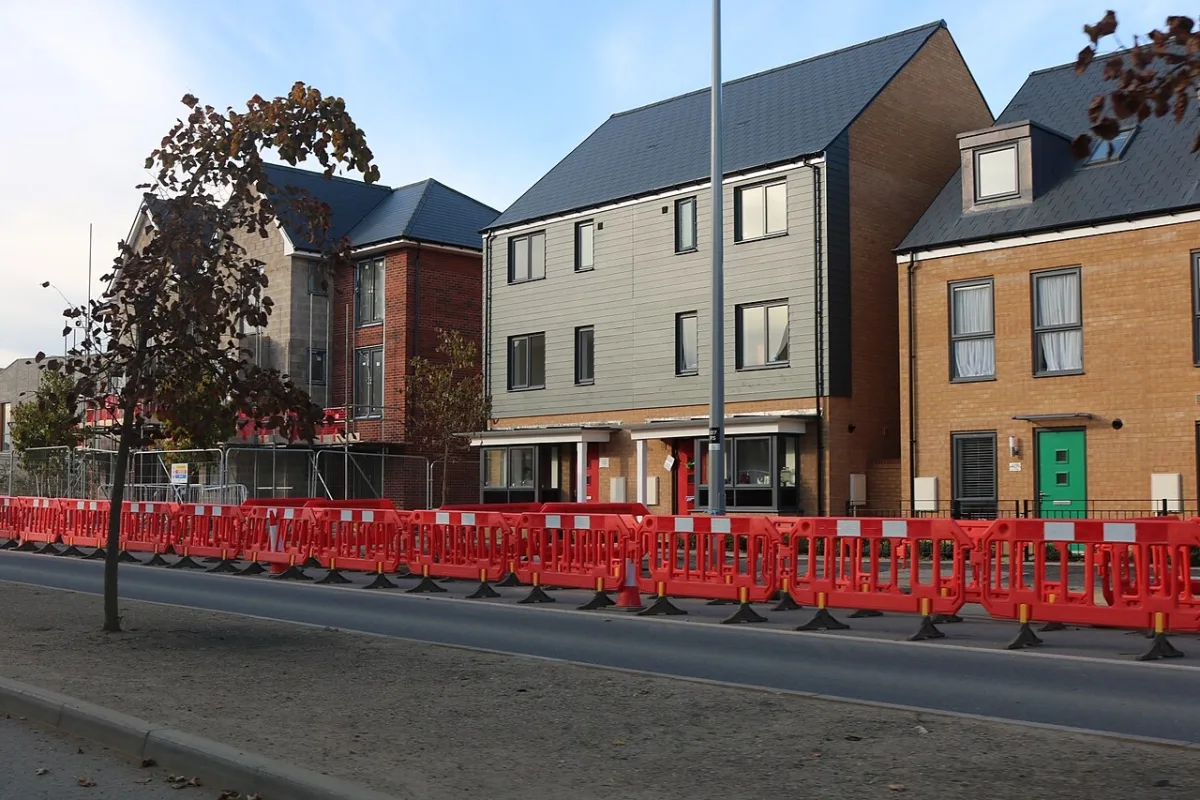

The average Milton Keynes home was worth £330,419 in July 2026, up 2.6% in a year and the highest on record. Median sold prices for all 18 MK postcode districts.
Milton Keynes house prices have just set a record. The average home in the city was worth £330,419 in July 2026, the highest figure in the official index since its Milton Keynes series began in December 2009. It is also a sharp turn: as recently as June the average was below where it had been a year earlier.
This page sets out what homes in Milton Keynes actually sell for: the official average, the direction it is moving, what you pay by property type, and the median sold price in every MK postcode district, worked out from HM Land Registry records of real completed sales.
The headline figure
The average home in Milton Keynes was worth £330,419 in July 2026, according to the UK House Price Index published by HM Land Registry and the ONS. That is up 2.6% on July 2025, when the average was £321,981, a gain of £8,438 in twelve months.
The comparison is what makes it interesting:
| Area | Average price | Change in the year |
|---|---|---|
| Milton Keynes | £330,419 | +2.6% |
| South East | £380,878 | +0.2% |
| England | £293,479 | +1.1% |
| United Kingdom | £272,611 | +1.4% |
So Milton Keynes sits about £37,000 above the England average and roughly £50,000 below the wider South East, and it grew faster over the year than any of the other three.
The turn was abrupt. The annual change was minus 1.2% in January, minus 2.6% in April, minus 0.4% in May and minus 0.1% in June before July’s plus 2.6%. The month-on-month rise of 1.6% in July was larger than in Bedford, Central Bedfordshire, West Northamptonshire, Buckinghamshire, the South East, England or the UK. We set the July figures out in full in our report on the record Milton Keynes average.
One caution before you read on: the index is a mean, not a median, and sales volumes are thin. Milton Keynes recorded 199 sales in May 2026, the most recent month for which volumes are published, against 1,116 sales in January to May as a whole. The postcode medians further down this page are the better guide to what a normal home fetches.
What it means for you
If you are selling, the market has turned in your favour, but on very few transactions. Price against what has actually completed near you rather than against the city headline. If you are buying, the average is £5,254 higher than it was in June, so the cheap window has closed, with flats the exception. If you are staying put, your home is worth about £8,400 more than a year ago on the official measure.
One local factor worth holding in mind: Milton Keynes has an unusually large pipeline of new homes, and the MK City Plan 2050 proposes tens of thousands more. Steady supply is part of why prices here have not climbed the way the rest of the South East has.
Prices by property type
The headline average hides a very wide spread. These are the district averages for July 2026 from the UK House Price Index, with the change over the year:
- Detached: £559,242, up 2.3%.
- Semi-detached: £334,664, up 4.0%, the strongest type.
- Terraced: £276,767, up 3.5%.
- Flats and maisonettes: £167,700, down 0.4%, the only type to fall.
Flats are the story. Milton Keynes has a large flat stock, a lot of it in and around the centre, and it is the one segment still worth less than a year ago. Houses have all recovered.
The index also splits buyers. A first-time buyer in Milton Keynes paid an average of £276,504 in July 2026, up 2.8% over the year. Someone selling one home to buy another, a former owner-occupier, paid £403,797, up 2.5%. The £127,000 gap between those two figures is the size of the step from a first flat or terrace to a family house here.
Sold prices by MK postcode district
The district average is one number for a city of 240,000 people spread across nineteen postcode districts, so it is worth going a level down. We pulled every residential sale recorded by HM Land Registry in the Milton Keynes local authority with a completion date between 1 July 2025 and mid-June 2026: 3,137 sales. These are prices actually paid, not asking prices.
The median across all 3,137 sales was £325,000, which lands almost exactly on the official index average and is a good sign the two measures agree.
A few things stand out:
- MK17 and MK46 lead, at £427,750 and £397,500. These are the village districts, Woburn Sands and Olney, where the housing stock is older, larger and detached.
- MK9, Central Milton Keynes, is the cheapest at £240,938. That is not a comment on the area so much as on what is there: CMK sales are overwhelmingly flats, and flats are the weakest segment in the city.
- MK10 is the busiest district in the city, with 254 sales, ahead of MK4 on 260 and MK3 on 326. Broughton and the eastern growth areas are where the volume is.
- The spread from top to bottom is about £187,000, which is a bigger range than the gap between the MK average and the England average.
Two caveats on reading this table. Sales are counted by the local authority the property sits in, so homes in the MK17, MK19, MK2, MK3 and MK16 postcode districts that fall outside the Milton Keynes boundary are excluded, even though they share the postcode. And Land Registry data lags: sales completing in the last few weeks of the window are still being registered, so the most recent volumes will rise.
How Milton Keynes compares on affordability
At £330,419 the average MK home costs about 1.13 times the England average. That is cheaper relative to earnings than most of the South East, and it is a large part of why the city keeps drawing people out of London. A season ticket to Euston runs to £7,024 a year, which is real money, but the price gap on a family house against comparable commuter towns closer in more than covers it.
Frequently asked questions
What is the average house price in Milton Keynes?
The average home in Milton Keynes was worth £330,419 in July 2026, according to the UK House Price Index built from HM Land Registry sales. That covers all property types across the whole Milton Keynes local authority, and it is a mean, not a median.
Are Milton Keynes house prices going up or down?
Up. Prices rose 2.6% in the year to July 2026, against 1.1% for England. That followed six months in which Milton Keynes prices were below where they had been a year earlier, bottoming at −2.6% in the year to April 2026.
Which is the most expensive part of Milton Keynes?
By median sold price over the last twelve months, MK17 around Woburn Sands is the priciest at £427,750, followed by MK46 around Olney at £397,500.
Which is the cheapest part of Milton Keynes?
MK9, Central Milton Keynes, at a median of £240,938. The district’s sales are dominated by flats, which average £167,700 across the city and fell 0.4% over the year, the only property type still down.
How much is a detached house in Milton Keynes?
A detached home averaged £559,242 in July 2026, up 2.3% over the year and about £225,000 more than the average semi-detached house.
Where can I check what a specific house sold for?
Every completed sale in England and Wales is public. Look up any street or address free on the HM Land Registry Price Paid service.
Sources
- UK House Price Index, Milton Keynes, July 2026 (HM Land Registry / ONS) for the district average, property-type, buyer-type and sales volume figures, read 19 September 2026.
- UK House Price Index, England, July 2026, South East and United Kingdom for the comparisons.
- HM Land Registry Price Paid Data for the 3,137 individual sales behind the postcode-district medians.
- HM Land Registry Price Paid search to check any individual address.
Index figures are provisional and revised as more sales complete. Always confirm the latest numbers against the linked sources before making a decision.
Have your say